
Many growth marketers confuse bounce rate and exit rate, but understanding the difference is crucial for optimizing conversion funnels and scaling user acquisition efforts. These metrics reveal different user behaviors that directly impact your growth strategy.
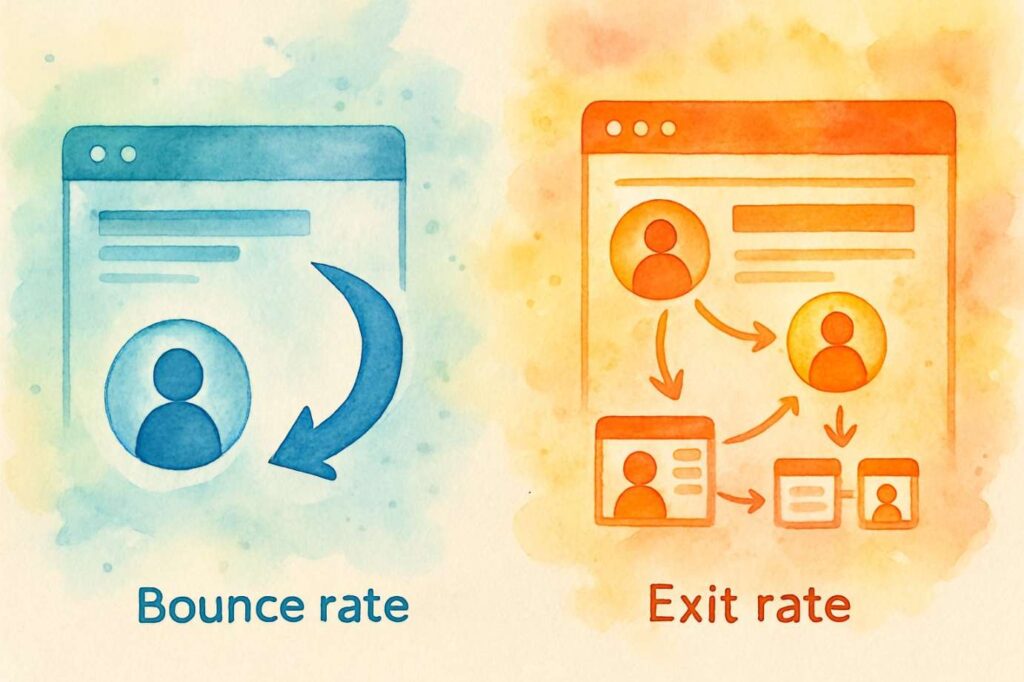
Bounce rate tracks visitors who leave after doing just one page visits. Exit rate shows which pages users visit last before leaving—regardless of how many pages they explored during their session.
Mastering these metrics helps identify specific growth bottlenecks and conversion opportunities. High bounce rates often signal traffic quality issues or landing page problems. High exit rates might reveal funnel leaks blocking users from converting.
What Is Bounce Rate?
Bounce rate measures single page session—visitors who leave without taking any action. The formula: (Single-Page Sessions ÷ Total Sessions) × 100
If 1,000 people land on your homepage and 300 leave immediately, your bounce rate is 30%. This metric only applies to entry pages and reflects first impression effectiveness.
Key characteristics:
- Only counts single page visits
- Applies to entry pages only
- Shows immediate exits
- Measures landing page performance
Even if someone spends 10 minutes reading your content without clicking elsewhere, that’s still a bounce. This doesn’t always indicate content failure. Context matters. Understanding when bounce occurs helps marketers better interpret this metric and make informed optimization decisions.
What Is Exit Rate
Exit rate measures what percentage of visitors leave your site from a particular page. Unlike bounce rate, this metric includes all exits regardless of how many pages users visited during their session.
The formula divides exits from a page by total page views for that page, multiplied by 100. If your pricing page received 1,000 views and 400 people left from that page, the exit rate is 40%.
Every web page on your site has an exit rate. Users must leave somewhere, so exit rates across all pages reflect your site’s overall user flow patterns. Some pages naturally have higher exit rates based on their function.
Exit rate includes both single-page visits and multi-page journeys. A user might browse your homepage, check three product pages, read your about page, then leave from your contact page. Only the contact page gets an exit for that session.
This metric helps identify where users drop out of your conversion funnel. High exit rates on key funnel pages suggest optimization opportunities or user experience problems that need attention.
Common Misconceptions
Many marketers think high bounce rates always indicate poor performance. A visitor lands on your blog post about “winter marketing trends,” finds exactly what they need, then leaves satisfied. That’s a bounce, but it represents successful content delivery.
Another common mistake is treating bounce and exit rate as interchangeable metrics. Bounce rate only applies to entry pages and single-page sessions. Exit rate applies to any page and includes multi-page visits.
Some believe low bounce rates automatically mean better performance. A page might have a low bounce rate because it confuses visitors into clicking around randomly, not because it effectively guides them toward conversion goals.
People often assume these metrics directly impact search engine rankings. While user engagement signals matter for SEO, bounce rate alone doesn’t determine search positions. Search engines consider many other factors when ranking pages.
Exit rate confusion happens when marketers panic about naturally high-exit pages. Your confirmation page after purchase completion will have a high exit rate because users finished their intended action and left satisfied.
Want expert help analyzing your Google Analytics performance?
Contact Growth Hackers
Key Differences for Growth Marketers
Bounce rate focuses on immediate engagement and first impressions. It shows whether your entry pages successfully hook visitors and encourage further exploration of your site. This metric directly relates to traffic quality and landing page effectiveness.
Exit rate reveals where users drop out of your conversion process. It identifies specific pages where potential customers decide to leave instead of moving closer to conversion. This metric helps optimize user flow and reduce funnel leakage.
Timing makes these metrics fundamentally different. Bounce rate measures immediate departure decisions made within seconds of arriving. Exit rate captures departure decisions made at any point during longer browsing sessions.
Context changes how you interpret each metric. A high bounce rate on a landing page usually signals problems. A high exit rate on the same page might be normal if users typically explore other pages first before returning to that page to leave.
All bounces count as exits, but not all exits are bounces. This mathematical relationship means exit rates typically run higher than bounce rates for most pages. Understanding this helps set realistic optimization targets.
Data Interpretation for Growth
Bounce Rate Analysis
Bounce rate directly reflects your ability to match user intent with page content. High bounce rates on landing pages suggest misalignment between your advertising message and page content. Visitors arrive expecting one thing but find something different.
Traffic source quality shows up clearly in bounce rate data. Organic search traffic often has lower bounce rates than display advertising because search users actively sought information related to your content. Social media traffic might bounce more because users casually clicked without strong intent.
Page loading speed dramatically affects bounce rates. Users abandon pages that take longer than three seconds to load. Mobile users are even less patient, often leaving after just two seconds of loading time.
Content structure impacts bounce engagement. Pages with clear headlines, scannable formatting, and obvious next steps keep users engaged longer. Dense text blocks or confusing layouts push bounce rates higher.
Technical issues cause immediate bounces. Broken functionality, mobile compatibility problems, or intrusive popups make users leave before evaluating your actual content or offers.
Exit Rate Applications
Exit rate analysis reveals conversion funnel weaknesses. High exit rates on product pages might indicate pricing concerns, insufficient product information, or unclear purchasing processes. Users interested enough to browse products shouldn’t leave without clear reasons.
Navigation problems show up in exit rate patterns. If users consistently leave from pages that should lead to conversions, your internal linking or page flow might need improvement. Clear next steps and compelling calls-to-action reduce unexpected exits.
Checkout abandonment appears as high exit rates on purchase-related pages. Shopping cart pages, billing information forms, or payment processing pages with high exits suggest friction in your conversion process.
Content gaps become visible through exit rate analysis. If users frequently exit from pages where they should find answers or solutions, your site content might not adequately address their needs or questions.
Mobile user behavior differs significantly from desktop patterns. Exit rates often vary between device types, revealing responsive design issues or mobile-specific user experience problems.
Industry Benchmarks
E-commerce Benchmarks
Online retail sites typically see average bounce rate between 20% and 45%. Product-focused pages should stay closer to the lower end, while content or blog pages might hit the higher range. Shopping sites want users to browse multiple products and categories.
Product page exit rates usually range from 20% to 50%. Higher exit rates might indicate price sensitivity, insufficient product details, or comparison shopping behavior. Category pages should have lower exit rates since they serve as navigation hubs.
Cart abandonment shows up as high exit rates on checkout pages, often ranging from 30% to 70%. This wide range depends on your checkout process complexity, surprise costs, or required account creation.
Mobile commerce typically sees higher bounce and exit rates than desktop. Smaller screens and touch interfaces create additional friction that impacts user behavior patterns.
SaaS and Lead Generation
Software and service businesses usually maintain average bounce rates between 30% and 50% on landing pages. These pages need to quickly communicate value propositions and guide users toward trial signups or demo requests.
Lead generation forms often have exit rates between 40% and 60%. Longer forms typically see higher exit rates as users abandon the process partway through completion.
Pricing pages in SaaS businesses frequently show exit rates of 50% to 70%. Users often research pricing then leave to consider options or compare competitors before returning later.
Free trial or demo request pages should maintain lower exit rates, ideally below 40%. High exits here suggest form optimization opportunities or unclear value communication.
Content and Publishing
Blog posts and content sites accept bounce rates between 65% and 90%. Readers often find specific information then leave, which represents successful content consumption rather than poor performance.
Newsletter signup pages might see exit rates of 60% to 80%. These pages serve specific functions and naturally conclude user sessions after completing or declining the signup process.
Content sites focus more on engagement metrics like time on page and pages per session rather than worrying about high bounce rates. Quality content consumption matters more than extensive site exploration.
Resource pages, guides, or downloadable content often have high exit rates after users obtain what they sought. This represents successful content delivery rather than optimization problems.

Factors Contributing to Bounce Rate
Technical Performance Issues
Page loading speed remains the most critical technical factor affecting bounce rates. Google research shows that bounce probability increases 32% when page load time goes from one to three seconds. At five seconds, bounce probability jumps to 90%.
Mobile performance requires even stricter standards. Mobile users expect pages to load within two seconds. Slower loading times on mobile devices result in significantly higher bounce rates than desktop equivalents.
Server response time affects user patience before pages even begin rendering content. Slow server responses create blank screens that make users assume pages are broken or unresponsive.
Large image files commonly cause loading delays. Unoptimized photos, graphics, or videos can add several seconds to page load times, directly increasing bounce rates across all traffic sources.
Third-party scripts and plugins often slow down page rendering. Social media widgets, analytics codes, or advertising scripts can delay content display, frustrating users who expect immediate access to information.
Content and Messaging Alignment
Misleading headlines or meta descriptions create expectation gaps that drive bounces. Users click expecting specific information but find unrelated or insufficient content on the landing page.
Search engine optimization keyword stuffing can attract wrong audiences. Pages optimized for broad keywords might rank well but attract users seeking different information, leading to high bounce rates.
Advertising message consistency directly impacts bounce rates from paid campaigns. Landing pages must match ad copy promises, visual elements, and value propositions to avoid immediate user disappointment.
Content quality and depth influence user decisions to explore further. Thin content, obvious sales pitches, or information that doesn’t add value encourage users to look elsewhere for better resources.
Visual hierarchy problems make pages difficult to scan quickly. Users form first impressions within milliseconds, so unclear layouts or confusing design elements trigger immediate departures.
User Experience Factors
Navigation complexity confuses first-time visitors. Unclear menu structures, missing search functionality, or too many choices can overwhelm users and encourage them to leave rather than figure out your site organization.
Intrusive popups or overlays interrupt user experience immediately after arrival. Exit-intent popups serve specific purposes, but immediate signup requests or promotional overlays often increase bounce rates.
Mobile responsiveness affects user experience across devices. Pages that don’t display properly on smartphones or tablets frustrate mobile users, who represent increasingly large portions of web traffic.
Readability issues include small fonts, poor color contrast, or dense text blocks that make content difficult to consume. Users won’t struggle to read your content when alternatives exist elsewhere.
Trust signals impact user confidence in staying and exploring. Missing contact information, unclear privacy policies, or unprofessional design elements make users cautious about engaging further with your site.
Traffic Source Quality
Paid advertising targeting affects bounce rate quality significantly. Broad keyword targeting or demographic settings might drive traffic from users with minimal interest in your specific offerings.
Social media traffic often produces higher bounce rates because users casually click links without strong purchase intent. Social visitors typically browse quickly then return to their social feeds.
Email marketing campaigns with unclear subject lines or irrelevant content can drive high bounce rates when recipients don’t find expected information on landing pages.
Referral traffic quality varies widely based on the referring site’s audience alignment with your target market. Relevant referral sources produce engaged traffic with lower bounce rates.
Organic search traffic usually demonstrates strong intent alignment, resulting in lower bounce rates when your content matches search queries effectively.
Boost conversions with smarter Google Analytics.
Work with Growth Hackers
Exit Rate Analysis for Conversion Optimization
Identifying Problem Pages
Product pages with exit rates above 60% often indicate user concerns about pricing, product fit, or available information. Users interested enough to view specific products shouldn’t leave without clear reasons or calls-to-action.
Checkout process pages reveal friction points when exit rates spike unexpectedly. Payment form abandonment, shipping cost surprises, or required account creation can drive users away at critical conversion moments.
Pricing pages frequently show high exit rates, but context matters. If users consistently exit after viewing prices without exploring other pages, your pricing strategy or value communication might need adjustment.
Contact forms or lead generation pages with high exit rates suggest form optimization opportunities. Long forms, unclear required fields, or insufficient privacy assurance can discourage completion.
Landing pages from paid campaigns should maintain relatively low exit rates. High exits suggest misalignment between advertising promises and actual page content or user experience.
Normal vs. Problematic Exit Patterns
Thank you pages naturally have high exit rates because users completed their intended actions. Order confirmation, download completion, or subscription confirmation pages serve as natural conclusion points.
About pages often show higher exit rates than other informational pages. Users seeking company information might leave after finding what they need, which represents successful information delivery. To better understand these patterns, analyze data using the following Google Analytics report sections that break down user behavior by page type and traffic source.
Final Thoughts on Bounce Rate vs Exit Rate Analytics
Understanding bounce rate vs exit rate distinctions empowers growth marketers to make data-driven optimization decisions that directly impact conversion performance. Bounce rate reveals first impression effectiveness and traffic quality, while exit rate identifies specific funnel leakage points where potential customers abandon their journey.
Mastering these metrics requires consistent analysis, strategic interpretation, and targeted optimization efforts across your entire conversion funnel. The key lies in recognizing when high rates signal genuine problems versus normal user behavior patterns that align with your business objectives.
If you’re ready to transform your analytics insights into measurable growth results, partnering with experts can accelerate your optimization efforts significantly.
Growth Hackers is a leading analytics marketing agency that specializes in turning data insights into sustainable business growth. We understand that interpreting bounce rates and exit rates is just the beginning—the real value comes from implementing strategic optimizations that reduce friction, improve user experience, and maximize conversion potential across every touchpoint in your customer journey.
Our team of experienced marketers, data analysts, and growth experts has spent over 10 years helping companies worldwide transform their analytics data into actionable growth strategies. We don’t just analyze your bounce and exit rate metrics; we execute comprehensive optimization campaigns that address technical performance issues, content alignment problems, and conversion funnel weaknesses that prevent your business from reaching its full potential.
Ready to turn your analytics insights into measurable growth? Contact Growth Hackers today for a free comprehensive audit of your website’s performance metrics and discover how we can help you optimize your conversion funnel for maximum results.